Intro
In this exercise, you will use LD score regression method to calculate the partitioned heritability of GWAS phenotype from UK Biobank.
Below is a step by step guide on setting up and running the analysis.
Conda set up
If you have conda installed on your machine skip this step
Installation
- Download Miniconda for your specific OS to your home directory
- Linux:
wget https://repo.continuum.io/miniconda/Miniconda3-latest-Linux-x86_64.sh - Mac:
curl https://repo.continuum.io/miniconda/Miniconda3-latest-MacOSX-x86_64.sh
- Linux:
- Run:
bash Miniconda3-latest-Linux-x86_64.shbash Miniconda3-latest-MacOSX-x86_64.sh
- Follow all the prompts: if unsure, accept defaults
- Close and re-open your terminal
- If the installation is successful, you should see a list of installed packages with
conda listIf the command cannot be found, you can add Anaconda bin to the path using:export PATH=~/miniconda3/bin:$PATH
LDSC set up
Download the ldsc and set up the environment
# Note: if you are using the cluster avoid running analysis on the head node instead use a computation node to make the process faster
sinteractive --account=hgen47100 --ntasks=1 --mem-per-cpu=8000 #slurm
qsub -I -l nodes=1:ppn=1,walltime=04:00:00,mem=8gb #pbs

#clone this repository
git clone https://github.com/bulik/ldsc.git
cd ldsc

# set up tools/packages and dependeciencies required using conda
conda env create --file environment.yml
conda activate ldsc

# test if set up is done
./ldsc.py -h
./munge_sumstats.py -h

cd ..
If these commands fail with an error, then something as gone wrong during the installation process.
Download the test files
# Summary stats
wget https://portals.broadinstitute.org/collaboration/giant/images/b/b7/GIANT_BMI_Speliotes2010_publicrelease_HapMapCeuFreq.txt.gz
# baseline model
wget https://storage.googleapis.com/broad-alkesgroup-public/LDSCORE/1000G_Phase1_baseline_ldscores.tgz
# standard regression weights
wget https://storage.googleapis.com/broad-alkesgroup-public/LDSCORE/weights_hm3_no_hla.tgz
# freq files
wget https://storage.googleapis.com/broad-alkesgroup-public/LDSCORE/1000G_Phase1_frq.tgz
# Hapmap3 snp list
wget https://storage.googleapis.com/broad-alkesgroup-public/LDSCORE/w_hm3.snplist.bz2
## cell  type groups
wget https://storage.googleapis.com/broad-alkesgroup-public/LDSCORE/1000G_Phase1_cell_type_groups.tgz

gunzip GIANT_BMI_Speliotes2010_publicrelease_HapMapCeuFreq.txt.gz
tar -xvzf 1000G_Phase1_baseline_ldscores.tgz
tar -xvzf weights_hm3_no_hla.tgz
tar -xvzf 1000G_Phase1_frq.tgz
tar -xvzf 1000G_Phase1_cell_type_groups.tgz
bunzip2 w_hm3.snplist.bz2
format summary stats
python ldsc/munge_sumstats.py \
--sumstats GIANT_BMI_Speliotes2010_publicrelease_HapMapCeuFreq.txt \
--merge-alleles w_hm3.snplist \
--chunksize 50000 \
--out BMI \
--a1-inc

Interpreting column names as follows:
Allele2:    Allele 2, interpreted as non-ref allele for signed sumstat.
MarkerName: Variant ID (e.g., rs number)
Allele1:    Allele 1, interpreted as ref allele for signed sumstat.
p:  p-Value
N:  Sample size

Reading list of SNPs for allele merge from w_hm3.snplist
Read 1217311 SNPs for allele merge.
Reading sumstats from GIANT_BMI_Speliotes2010_publicrelease_HapMapCeuFreq.txt into memory 50000 SNPs at a time.
.................................................. done
Read 2471516 SNPs from --sumstats file.
Removed 1400863 SNPs not in --merge-alleles.
Removed 0 SNPs with missing values.
Removed 0 SNPs with INFO <= 0.9.
Removed 0 SNPs with MAF <= 0.01.
Removed 0 SNPs with out-of-bounds p-values.
Removed 6 variants that were not SNPs or were strand-ambiguous.
1070647 SNPs remain.
Removed 0 SNPs with duplicated rs numbers (1070647 SNPs remain).
Removed 29808 SNPs with N < 82575.3333333 (1040839 SNPs remain).
Removed 36 SNPs whose alleles did not match --merge-alleles (1040803 SNPs remain).
Writing summary statistics for 1217311 SNPs (1040803 with nonmissing beta) to BMI.sumstats.gz.

Metadata:
Mean chi^2 = 1.112
Lambda GC = 1.038
Max chi^2 = 277.2
337 Genome-wide significant SNPs (some may have been removed by filtering).

Conversion finished at Tue Feb 22 10:27:55 2022
Total time elapsed: 41.74s
Partitioned heritability
In this exercise we are fitting this model which allows us to capture h2 for each category \[\Large E \left [X_{j}^{2} \right] = \Large N \sum_{C}\tau_{C} \ell(j,C) + Na + 1 \tag{1}\] where \(N\) is sample size, \(C\) indexes categories, \(\ell(j,C)\) is the LD Score of SNP \(j\) with respect to category \(C\); defined as \[\ell(j,C) = \sum_{k \in C} r_{jk}^2\] \(a\) is a term that measures the contribution of confounding biases and \(\tau_{C}\) represents the per-SNP contribution to heritability of category \(C\).
Note: We wont be using this model which estimates h2 using all the SNPs \[\Large E\left [\chi^2 \mid \ell_{j} \right ] = Nh^2\ell_{j}/M + Na + 1 \tag{2}\]
Unlike the original ldsc (model 2) where ldscore is calculated using all the snps and the regression has one “covariate”, with stratified regression (model 1) we regress against ldscores from multiple categories and that helps us estimate the contribution to the heritability given by the category.
The stratified regression is implemented in ldsc software and we will need to provide the required infomation through the command line arguments below;
–w-ld-chr should be computed as sum r2 over SNPs in the regression, i.e., the SNPs for which you have Z-scores. The LD Scores are just used for weighting the regression and generally do not have a huge impact on the results.
–ref-ld-chr contains the partioned LD scores from the total 53 (overlapping) functional categories in the full baseline model, including a category containing all SNPs.
The functional annotations were derived from the catrgories below;

–frqfile-chr provide allele frequecy information. ldsc needs to know how many SNPs with MAF > 5% there are in every pairwise intersection of categories.
–overlap-annot tells ldsc that the categories you used to generate the baseline overlap with each other
python ldsc/ldsc.py \
    --h2 BMI.sumstats.gz \
    --ref-ld-chr baseline/baseline. \
    --w-ld-chr weights_hm3_no_hla/weights. \
    --overlap-annot \
    --frqfile-chr 1000G_frq/1000G.mac5eur. \
    --out BMI_baseline

*********************************************************************
* LD Score Regression (LDSC)
* Version 1.0.1
* (C) 2014-2019 Brendan Bulik-Sullivan and Hilary Finucane
* Broad Institute of MIT and Harvard / MIT Department of Mathematics
* GNU General Public License v3
*********************************************************************
Call:
./ldsc.py \
--h2 BMI.sumstats.gz \
--ref-ld-chr baseline/baseline. \
--out BMI_baseline \
--overlap-annot  \
--frqfile-chr 1000G_frq/1000G.mac5eur. \
--w-ld-chr weights_hm3_no_hla/weights.

Beginning analysis at Tue Feb 22 10:40:24 2022
Reading summary statistics from BMI.sumstats.gz ...
Read summary statistics for 1040803 SNPs.
Reading reference panel LD Score from baseline/baseline.[1-22] ... (ldscore_fromlist)
Read reference panel LD Scores for 1189907 SNPs.
Removing partitioned LD Scores with zero variance.
Reading regression weight LD Score from weights_hm3_no_hla/weights.[1-22] ... (ldscore_fromlist)
Read regression weight LD Scores for 1242190 SNPs.
After merging with reference panel LD, 948813 SNPs remain.
After merging with regression SNP LD, 946647 SNPs remain.
Removed 17 SNPs with chi^2 > 123.912 (946630 SNPs remain)
Total Observed scale h2: 0.131 (0.0078)
Categories: base_0 Coding_UCSC_0 Coding_UCSC.extend.500_0 Conserved_LindbladToh_0 Conserved_LindbladToh.extend.500_0 CTCF_Hoffman_0 CTCF_Hoffman.extend.500_0 DGF_ENCODE_0 DGF_ENCODE.extend.500_0 DHS_peaks_Trynka_0 DHS_Trynka_0 DHS_Trynka.extend.500_0 Enhancer_Andersson_0 Enhancer_Andersson.extend.500_0 Enhancer_Hoffman_0 Enhancer_Hoffman.extend.500_0 FetalDHS_Trynka_0 FetalDHS_Trynka.extend.500_0 H3K27ac_Hnisz_0 H3K27ac_Hnisz.extend.500_0 H3K27ac_PGC2_0 H3K27ac_PGC2.extend.500_0 H3K4me1_peaks_Trynka_0 H3K4me1_Trynka_0 H3K4me1_Trynka.extend.500_0 H3K4me3_peaks_Trynka_0 H3K4me3_Trynka_0 H3K4me3_Trynka.extend.500_0 H3K9ac_peaks_Trynka_0 H3K9ac_Trynka_0 H3K9ac_Trynka.extend.500_0 Intron_UCSC_0 Intron_UCSC.extend.500_0 PromoterFlanking_Hoffman_0 PromoterFlanking_Hoffman.extend.500_0 Promoter_UCSC_0 Promoter_UCSC.extend.500_0 Repressed_Hoffman_0 Repressed_Hoffman.extend.500_0 SuperEnhancer_Hnisz_0 SuperEnhancer_Hnisz.extend.500_0 TFBS_ENCODE_0 TFBS_ENCODE.extend.500_0 Transcribed_Hoffman_0 Transcribed_Hoffman.extend.500_0 TSS_Hoffman_0 TSS_Hoffman.extend.500_0 UTR_3_UCSC_0 UTR_3_UCSC.extend.500_0 UTR_5_UCSC_0 UTR_5_UCSC.extend.500_0 WeakEnhancer_Hoffman_0 WeakEnhancer_Hoffman.extend.500_0
Lambda GC: 1.0375
Mean Chi^2: 1.1104
Intercept: 0.7756 (0.0106)
Ratio < 0 (usually indicates GC correction).
Reading annot matrix from baseline/baseline.[1-22] ... (annot)
Results printed to BMI_baseline.results
Analysis finished at Tue Feb 22 10:42:13 2022
Total time elapsed: 1.0m:49.43s
Visualize the partioned heritability
library(data.table)
library(tidyverse)
h2 <- "/Volumes/im-lab/nas40t2/festus/metabolomics/guardian/MetaboXcan/ldsc_data/BMI_baseline.results"

h2 <- fread(h2)

# Barplot
h2 %>% arrange(desc(Prop._h2)) %>%
  mutate(Category = str_remove(Category, "_0")) %>%
  mutate(Category = factor(Category, level = Category)) %>%
  pivot_longer(.,cols = c(Prop._SNPs,Prop._h2),names_to = "Proportion") %>%
  ggplot(., aes(x=Category, y=value)) +
  geom_bar(aes(fill = Proportion),stat = "identity",position = "dodge") +
  theme(axis.text.x = element_text(angle = 90, vjust = 0.5, hjust=1)) +
  ggtitle("Proportion of h2 explained and snps used by each category") +
  ylab("proportion") + xlab("Category")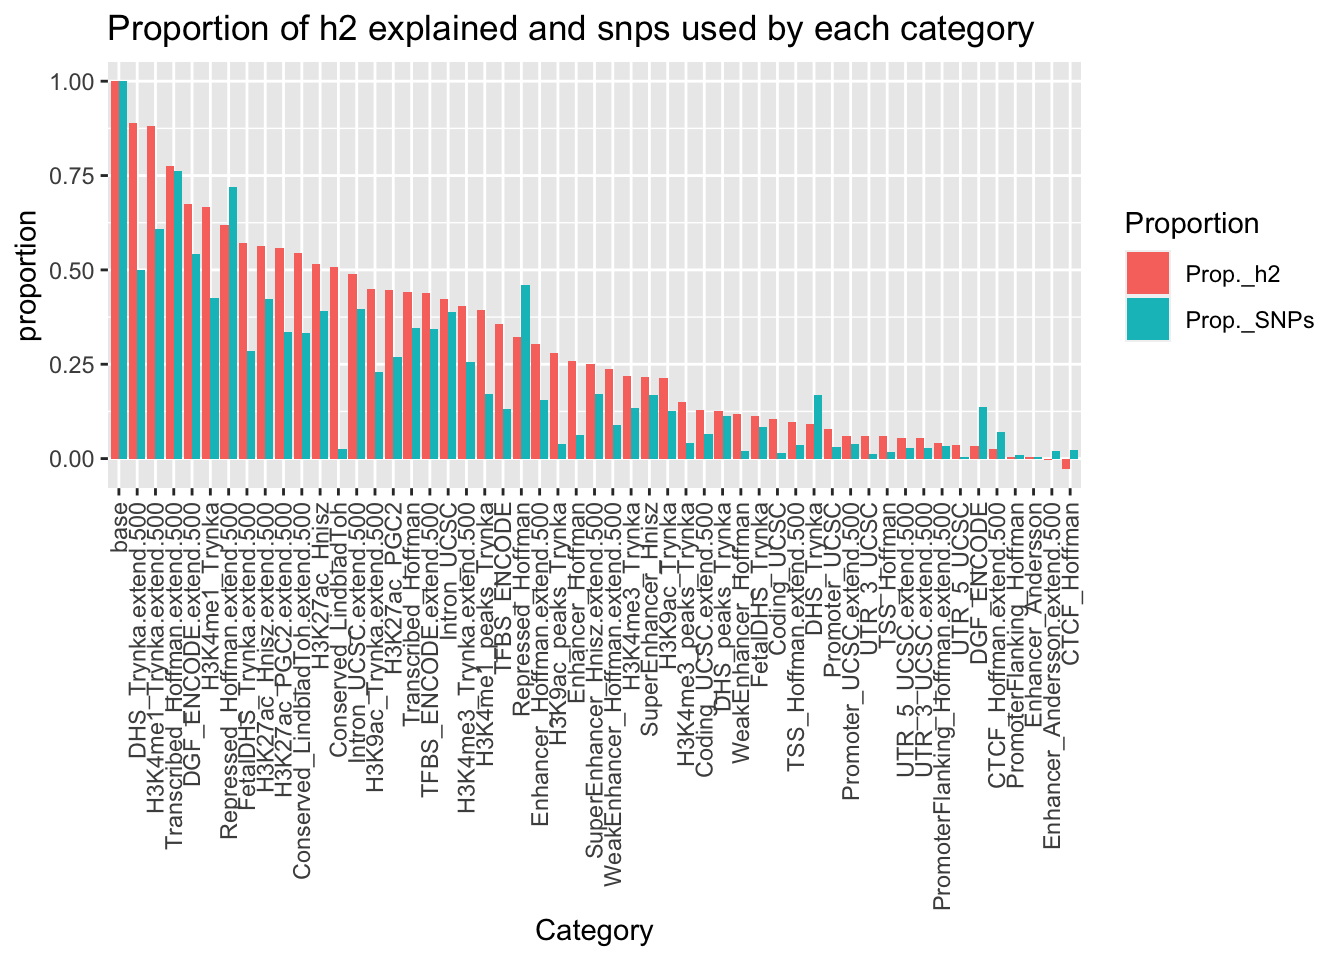
# enrichment plot
h2 %>% mutate(Category = str_remove(Category, "_0")) %>%
  ggplot(., aes(x=Category, y=-log10(Enrichment_p))) +
  geom_hline(yintercept=-log10(0.05/nrow(h2)),linetype=2) +
  geom_bar(stat = "identity",position = "dodge") +
  theme(axis.text.x = element_text(angle = 90, vjust = 0.5, hjust=1)) +
  ggtitle("Enrichment of different categories") +
  ylab("-log10(p)") + xlab("Category") +
coord_flip() 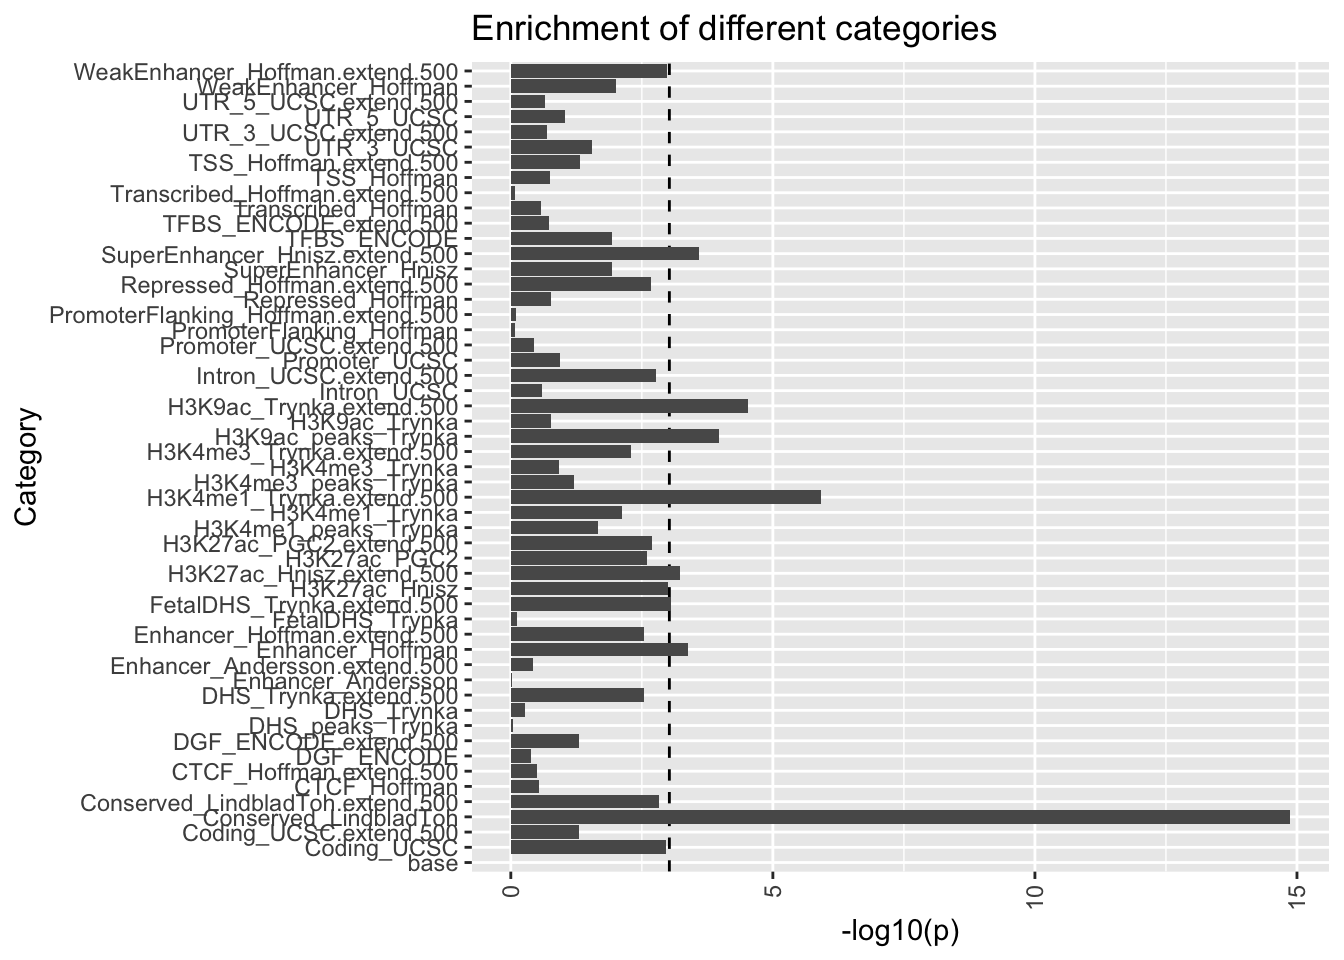
The dotted line shows the bonferonni significance at \(\alpha\) cut off of 0.05.
Estimating proportion of heritability by cell-type group
Run a cell type specific analysis to prioritize relevant cell types and estimate proportion of heritability for the cell type. Useful if you want to compares different cells. We will run three cell-type groups CNS, SkeletalMuscle and Immune.
# CNS
python ldsc/ldsc.py \
        --h2 BMI.sumstats.gz \
        --ref-ld-chr cell_type_groups/CNS.,baseline/baseline. \
        --w-ld-chr weights_hm3_no_hla/weights. \
        --overlap-annot \
        --print-coefficients \
        --frqfile-chr 1000G_frq/1000G.mac5eur. \
        --out BMI_CNS

*********************************************************************
* LD Score Regression (LDSC)
* Version 1.0.1
* (C) 2014-2019 Brendan Bulik-Sullivan and Hilary Finucane
* Broad Institute of MIT and Harvard / MIT Department of Mathematics
* GNU General Public License v3
*********************************************************************
Call:
./ldsc.py \
--h2 BMI.sumstats.gz \
--ref-ld-chr cell_type_groups/CNS.,baseline/baseline. \
--out BMI_CNS \
--overlap-annot  \
--frqfile-chr 1000G_frq/1000G.mac5eur. \
--w-ld-chr weights_hm3_no_hla/weights. \
--print-coefficients

Beginning analysis at Tue Feb 22 11:41:28 2022
Reading summary statistics from BMI.sumstats.gz ...
Read summary statistics for 1040803 SNPs.
Reading reference panel LD Score from cell_type_groups/CNS.,baseline/baseline.[1-22] ... (ldscore_fromlist)
Read reference panel LD Scores for 1189907 SNPs.
Removing partitioned LD Scores with zero variance.
Reading regression weight LD Score from weights_hm3_no_hla/weights.[1-22] ... (ldscore_fromlist)
Read regression weight LD Scores for 1242190 SNPs.
After merging with reference panel LD, 948813 SNPs remain.
After merging with regression SNP LD, 946647 SNPs remain.
Removed 17 SNPs with chi^2 > 123.912 (946630 SNPs remain)
Total Observed scale h2: 0.1319 (0.0078)
Categories: CNS_0 base_1 Coding_UCSC_1 Coding_UCSC.extend.500_1 Conserved_LindbladToh_1 Conserved_LindbladToh.extend.500_1 CTCF_Hoffman_1 CTCF_Hoffman.extend.500_1 DGF_ENCODE_1 DGF_ENCODE.extend.500_1 DHS_peaks_Trynka_1 DHS_Trynka_1 DHS_Trynka.extend.500_1 Enhancer_Andersson_1 Enhancer_Andersson.extend.500_1 Enhancer_Hoffman_1 Enhancer_Hoffman.extend.500_1 FetalDHS_Trynka_1 FetalDHS_Trynka.extend.500_1 H3K27ac_Hnisz_1 H3K27ac_Hnisz.extend.500_1 H3K27ac_PGC2_1 H3K27ac_PGC2.extend.500_1 H3K4me1_peaks_Trynka_1 H3K4me1_Trynka_1 H3K4me1_Trynka.extend.500_1 H3K4me3_peaks_Trynka_1 H3K4me3_Trynka_1 H3K4me3_Trynka.extend.500_1 H3K9ac_peaks_Trynka_1 H3K9ac_Trynka_1 H3K9ac_Trynka.extend.500_1 Intron_UCSC_1 Intron_UCSC.extend.500_1 PromoterFlanking_Hoffman_1 PromoterFlanking_Hoffman.extend.500_1 Promoter_UCSC_1 Promoter_UCSC.extend.500_1 Repressed_Hoffman_1 Repressed_Hoffman.extend.500_1 SuperEnhancer_Hnisz_1 SuperEnhancer_Hnisz.extend.500_1 TFBS_ENCODE_1 TFBS_ENCODE.extend.500_1 Transcribed_Hoffman_1 Transcribed_Hoffman.extend.500_1 TSS_Hoffman_1 TSS_Hoffman.extend.500_1 UTR_3_UCSC_1 UTR_3_UCSC.extend.500_1 UTR_5_UCSC_1 UTR_5_UCSC.extend.500_1 WeakEnhancer_Hoffman_1 WeakEnhancer_Hoffman.extend.500_1
Lambda GC: 1.0375
Mean Chi^2: 1.1104
Intercept: 0.774 (0.0105)
Ratio < 0 (usually indicates GC correction).
Reading annot matrix from cell_type_groups/CNS.,baseline/baseline.[1-22] ... (annot)
Results printed to BMI_CNS.results
Analysis finished at Tue Feb 22 11:43:57 2022
Total time elapsed: 2.0m:28.71s

# SkeletalMuscle
python ldsc/ldsc.py \
        --h2 BMI.sumstats.gz \
        --ref-ld-chr cell_type_groups/SkeletalMuscle.,baseline/baseline. \
        --w-ld-chr weights_hm3_no_hla/weights. \
        --overlap-annot \
        --print-coefficients \
        --frqfile-chr 1000G_frq/1000G.mac5eur. \
        --out BMI_SkeletalMuscle

*********************************************************************
* LD Score Regression (LDSC)
* Version 1.0.1
* (C) 2014-2019 Brendan Bulik-Sullivan and Hilary Finucane
* Broad Institute of MIT and Harvard / MIT Department of Mathematics
* GNU General Public License v3
*********************************************************************
Call:
./ldsc.py \
--h2 BMI.sumstats.gz \
--ref-ld-chr cell_type_groups/SkeletalMuscle.,baseline/baseline. \
--out BMI_SkeletalMuscle \
--overlap-annot  \
--frqfile-chr 1000G_frq/1000G.mac5eur. \
--w-ld-chr weights_hm3_no_hla/weights. \
--print-coefficients

Beginning analysis at Tue Feb 22 14:49:43 2022
Reading summary statistics from BMI.sumstats.gz ...
Read summary statistics for 1040803 SNPs.
Reading reference panel LD Score from cell_type_groups/SkeletalMuscle.,baseline/baseline.[1-22] ... (ldscore_fromlist)
Read reference panel LD Scores for 1189907 SNPs.
Removing partitioned LD Scores with zero variance.
Reading regression weight LD Score from weights_hm3_no_hla/weights.[1-22] ... (ldscore_fromlist)
Read regression weight LD Scores for 1242190 SNPs.
After merging with reference panel LD, 948813 SNPs remain.
After merging with regression SNP LD, 946647 SNPs remain.
Removed 17 SNPs with chi^2 > 123.912 (946630 SNPs remain)
Total Observed scale h2: 0.1313 (0.0079)
Categories: SkeletalMuscle_0 base_1 Coding_UCSC_1 Coding_UCSC.extend.500_1 Conserved_LindbladToh_1 Conserved_LindbladToh.extend.500_1 CTCF_Hoffman_1 CTCF_Hoffman.extend.500_1 DGF_ENCODE_1 DGF_ENCODE.extend.500_1 DHS_peaks_Trynka_1 DHS_Trynka_1 DHS_Trynka.extend.500_1 Enhancer_Andersson_1 Enhancer_Andersson.extend.500_1 Enhancer_Hoffman_1 Enhancer_Hoffman.extend.500_1 FetalDHS_Trynka_1 FetalDHS_Trynka.extend.500_1 H3K27ac_Hnisz_1 H3K27ac_Hnisz.extend.500_1 H3K27ac_PGC2_1 H3K27ac_PGC2.extend.500_1 H3K4me1_peaks_Trynka_1 H3K4me1_Trynka_1 H3K4me1_Trynka.extend.500_1 H3K4me3_peaks_Trynka_1 H3K4me3_Trynka_1 H3K4me3_Trynka.extend.500_1 H3K9ac_peaks_Trynka_1 H3K9ac_Trynka_1 H3K9ac_Trynka.extend.500_1 Intron_UCSC_1 Intron_UCSC.extend.500_1 PromoterFlanking_Hoffman_1 PromoterFlanking_Hoffman.extend.500_1 Promoter_UCSC_1 Promoter_UCSC.extend.500_1 Repressed_Hoffman_1 Repressed_Hoffman.extend.500_1 SuperEnhancer_Hnisz_1 SuperEnhancer_Hnisz.extend.500_1 TFBS_ENCODE_1 TFBS_ENCODE.extend.500_1 Transcribed_Hoffman_1 Transcribed_Hoffman.extend.500_1 TSS_Hoffman_1 TSS_Hoffman.extend.500_1 UTR_3_UCSC_1 UTR_3_UCSC.extend.500_1 UTR_5_UCSC_1 UTR_5_UCSC.extend.500_1 WeakEnhancer_Hoffman_1 WeakEnhancer_Hoffman.extend.500_1
Lambda GC: 1.0375
Mean Chi^2: 1.1104
Intercept: 0.7753 (0.0107)
Ratio < 0 (usually indicates GC correction).
Reading annot matrix from cell_type_groups/SkeletalMuscle.,baseline/baseline.[1-22] ... (annot)
Results printed to BMI_SkeletalMuscle.results
Analysis finished at Tue Feb 22 14:52:01 2022
Total time elapsed: 2.0m:17.73s

# Immune
python ldsc/ldsc.py \
        --h2 BMI.sumstats.gz \
        --ref-ld-chr cell_type_groups/Immune.,baseline/baseline. \
        --w-ld-chr weights_hm3_no_hla/weights. \
        --overlap-annot \
        --print-coefficients \
        --frqfile-chr 1000G_frq/1000G.mac5eur. \
        --out BMI_Immune

*********************************************************************
* LD Score Regression (LDSC)
* Version 1.0.1
* (C) 2014-2019 Brendan Bulik-Sullivan and Hilary Finucane
* Broad Institute of MIT and Harvard / MIT Department of Mathematics
* GNU General Public License v3
*********************************************************************
Call:
./ldsc.py \
--h2 BMI.sumstats.gz \
--ref-ld-chr cell_type_groups/Immune.,baseline/baseline. \
--out BMI_Immune \
--overlap-annot  \
--frqfile-chr 1000G_frq/1000G.mac5eur. \
--w-ld-chr weights_hm3_no_hla/weights. \
--print-coefficients

Beginning analysis at Tue Feb 22 15:03:23 2022
Reading summary statistics from BMI.sumstats.gz ...
Read summary statistics for 1040803 SNPs.
Reading reference panel LD Score from cell_type_groups/Immune.,baseline/baseline.[1-22] ... (ldscore_fromlist)
Read reference panel LD Scores for 1189907 SNPs.
Removing partitioned LD Scores with zero variance.
Reading regression weight LD Score from weights_hm3_no_hla/weights.[1-22] ... (ldscore_fromlist)
Read regression weight LD Scores for 1242190 SNPs.
After merging with reference panel LD, 948813 SNPs remain.
After merging with regression SNP LD, 946647 SNPs remain.
Removed 17 SNPs with chi^2 > 123.912 (946630 SNPs remain)
Total Observed scale h2: 0.1306 (0.0078)
Categories: Immune_0 base_1 Coding_UCSC_1 Coding_UCSC.extend.500_1 Conserved_LindbladToh_1 Conserved_LindbladToh.extend.500_1 CTCF_Hoffman_1 CTCF_Hoffman.extend.500_1 DGF_ENCODE_1 DGF_ENCODE.extend.500_1 DHS_peaks_Trynka_1 DHS_Trynka_1 DHS_Trynka.extend.500_1 Enhancer_Andersson_1 Enhancer_Andersson.extend.500_1 Enhancer_Hoffman_1 Enhancer_Hoffman.extend.500_1 FetalDHS_Trynka_1 FetalDHS_Trynka.extend.500_1 H3K27ac_Hnisz_1 H3K27ac_Hnisz.extend.500_1 H3K27ac_PGC2_1 H3K27ac_PGC2.extend.500_1 H3K4me1_peaks_Trynka_1 H3K4me1_Trynka_1 H3K4me1_Trynka.extend.500_1 H3K4me3_peaks_Trynka_1 H3K4me3_Trynka_1 H3K4me3_Trynka.extend.500_1 H3K9ac_peaks_Trynka_1 H3K9ac_Trynka_1 H3K9ac_Trynka.extend.500_1 Intron_UCSC_1 Intron_UCSC.extend.500_1 PromoterFlanking_Hoffman_1 PromoterFlanking_Hoffman.extend.500_1 Promoter_UCSC_1 Promoter_UCSC.extend.500_1 Repressed_Hoffman_1 Repressed_Hoffman.extend.500_1 SuperEnhancer_Hnisz_1 SuperEnhancer_Hnisz.extend.500_1 TFBS_ENCODE_1 TFBS_ENCODE.extend.500_1 Transcribed_Hoffman_1 Transcribed_Hoffman.extend.500_1 TSS_Hoffman_1 TSS_Hoffman.extend.500_1 UTR_3_UCSC_1 UTR_3_UCSC.extend.500_1 UTR_5_UCSC_1 UTR_5_UCSC.extend.500_1 WeakEnhancer_Hoffman_1 WeakEnhancer_Hoffman.extend.500_1
Lambda GC: 1.0375
Mean Chi^2: 1.1104
Intercept: 0.7763 (0.0105)
Ratio < 0 (usually indicates GC correction).
Reading annot matrix from cell_type_groups/Immune.,baseline/baseline.[1-22] ... (annot)
Results printed to BMI_Immune.results
Analysis finished at Tue Feb 22 15:05:47 2022
Total time elapsed: 2.0m:23.72s
Visualize h2 estimate by cell type
cns <- "/Volumes/im-lab/nas40t2/festus/metabolomics/guardian/MetaboXcan/ldsc_data/BMI_CNS.results"
ske <- "/Volumes/im-lab/nas40t2/festus/metabolomics/guardian/MetaboXcan/ldsc_data/BMI_SkeletalMuscle.results"
immune <- "/Volumes/im-lab/nas40t2/festus/metabolomics/guardian/MetaboXcan/ldsc_data/BMI_Immune.results"

cns <- fread(cns)
ske <- fread(ske)
immune <- fread(immune)

cns %>% dplyr::filter(Category == "CNS_0") %>% mutate(Cell_type = "CNS") %>%
  bind_rows(ske %>% dplyr::filter(Category == "SkeletalMuscle_0") %>%
              mutate(Cell_type = "SkeletalMuscle")) %>%
  bind_rows(immune %>% dplyr::filter(Category == "Immune_0") %>%
              mutate(Cell_type = "Immune")) %>%
  #mutate(Category = factor(Category, level = Category)) %>%
  ggplot(., aes(x=Category, y=Prop._h2)) +
  geom_bar(aes(fill = Cell_type),stat = "identity",position = "dodge") +
  theme(axis.text.x = element_text(angle = 90, vjust = 0.5, hjust=1))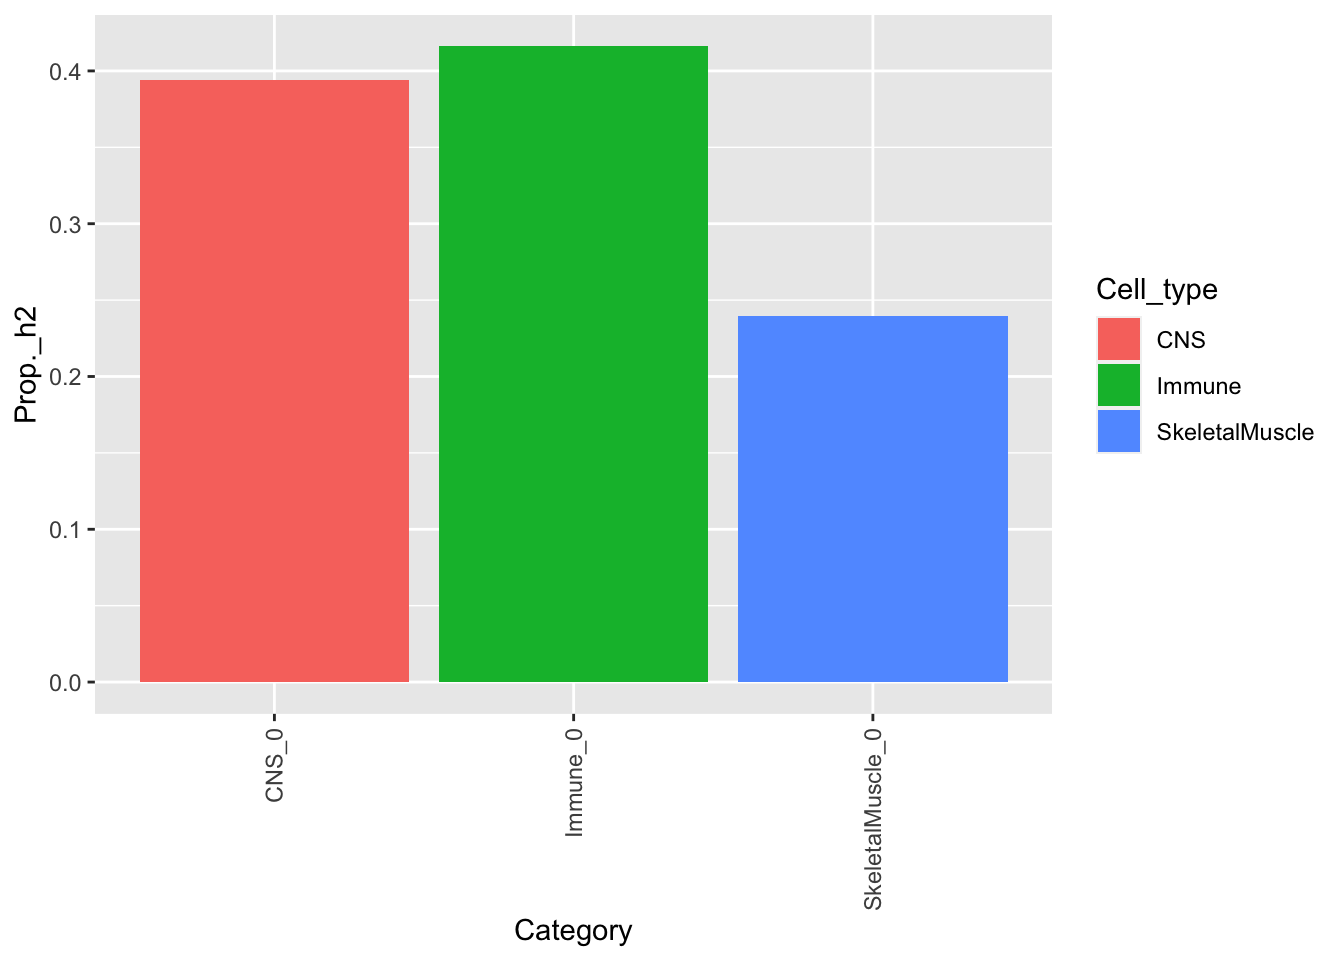
Cell type specific analyses
A more efficient way to do cell type-specific analyses using the --h2-cts flag.Gives you simple results. We will need a different set of the ref models.
# Choose which set of gene sets to analyze.
# Options include Multi_tissue_gene_expr, Multi_tissue_chromatin, GTEx_brain, Cahoy, ImmGen, or Corces_ATAC

# select cell type to test
cts_name=Cahoy

# Download the LD scores
wget https://data.broadinstitute.org/alkesgroup/LDSCORE/LDSC_SEG_ldscores/${cts_name}_1000Gv3_ldscores.tgz
wget https://data.broadinstitute.org/alkesgroup/LDSCORE/1000G_Phase3_baseline_ldscores.tgz
tar -xvzf ${cts_name}_1000Gv3_ldscores.tgz
tar -xvzf 1000G_Phase3_baseline_ldscores.tgz

python ldsc/ldsc.py \
    --h2-cts BMI.sumstats.gz \
    --ref-ld-chr 1000G_EUR_Phase3_baseline/baseline. \
    --out BMI_${cts_name} \
    --ref-ld-chr-cts ${cts_name}.ldcts \
    --w-ld-chr weights_hm3_no_hla/weights.

*********************************************************************
* LD Score Regression (LDSC)
* Version 1.0.1
* (C) 2014-2019 Brendan Bulik-Sullivan and Hilary Finucane
* Broad Institute of MIT and Harvard / MIT Department of Mathematics
* GNU General Public License v3
*********************************************************************
Call:
./ldsc.py \
--h2-cts BMI.sumstats.gz \
--ref-ld-chr 1000G_EUR_Phase3_baseline/baseline. \
--out BMI_Cahoy \
--ref-ld-chr-cts Cahoy.ldcts \
--w-ld-chr weights_hm3_no_hla/weights.

Beginning analysis at Tue Feb 22 15:32:34 2022
Reading summary statistics from BMI.sumstats.gz ...
Read summary statistics for 1040803 SNPs.
Reading reference panel LD Score from 1000G_EUR_Phase3_baseline/baseline.[1-22] ... (ldscore_fromlist)
Read reference panel LD Scores for 1190321 SNPs.
Removing partitioned LD Scores with zero variance.
Reading regression weight LD Score from weights_hm3_no_hla/weights.[1-22] ... (ldscore_fromlist)
Read regression weight LD Scores for 1242190 SNPs.
After merging with reference panel LD, 1029225 SNPs remain.
After merging with regression SNP LD, 938794 SNPs remain.
Removed 16 SNPs with chi^2 > 123.912 (938778 SNPs remain)
Reading cts reference panel LD Score from Cahoy_1000Gv3_ldscores/Cahoy.1.,Cahoy_1000Gv3_ldscores/Cahoy.control.[1-22] ... (ldscore_fromlist)
Performing regression.
Reading cts reference panel LD Score from Cahoy_1000Gv3_ldscores/Cahoy.2.,Cahoy_1000Gv3_ldscores/Cahoy.control.[1-22] ... (ldscore_fromlist)
Performing regression.
Reading cts reference panel LD Score from Cahoy_1000Gv3_ldscores/Cahoy.3.,Cahoy_1000Gv3_ldscores/Cahoy.control.[1-22] ... (ldscore_fromlist)
Performing regression.
Results printed to BMI_Cahoy.cell_type_results.txt
Analysis finished at Tue Feb 22 15:36:40 2022
Total time elapsed: 4.0m:6.07s
Visualize the cell specific analyses results
cts <- "/Volumes/im-lab/nas40t2/festus/metabolomics/guardian/MetaboXcan/ldsc_data/BMI_Cahoy.cell_type_results.txt"

cts <- fread(cts)
cts
## Name Coefficient Coefficient_std_error Coefficient_P_value
## 1: Neuron 3.717499e-09 2.995094e-09 0.1072667
## 2: Oligodendrocyte -2.077678e-09 2.564662e-09 0.7910636
## 3: Astrocyte -4.014899e-09 2.491836e-09 0.9464343ggplot(data = cts, aes(x = Name, y = -log10(Coefficient_P_value))) +
geom_point(aes(color = Name))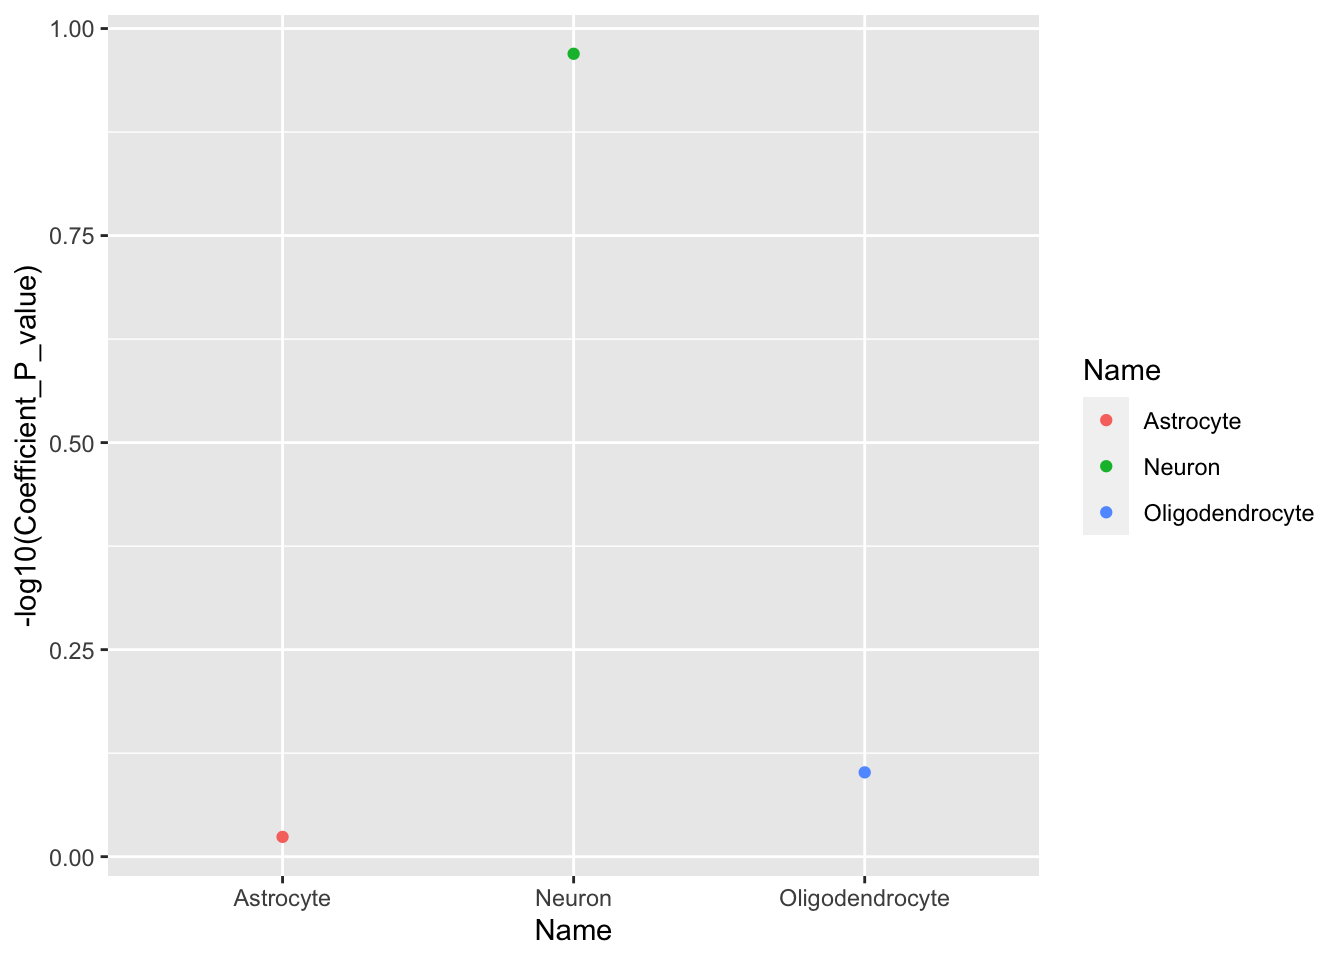
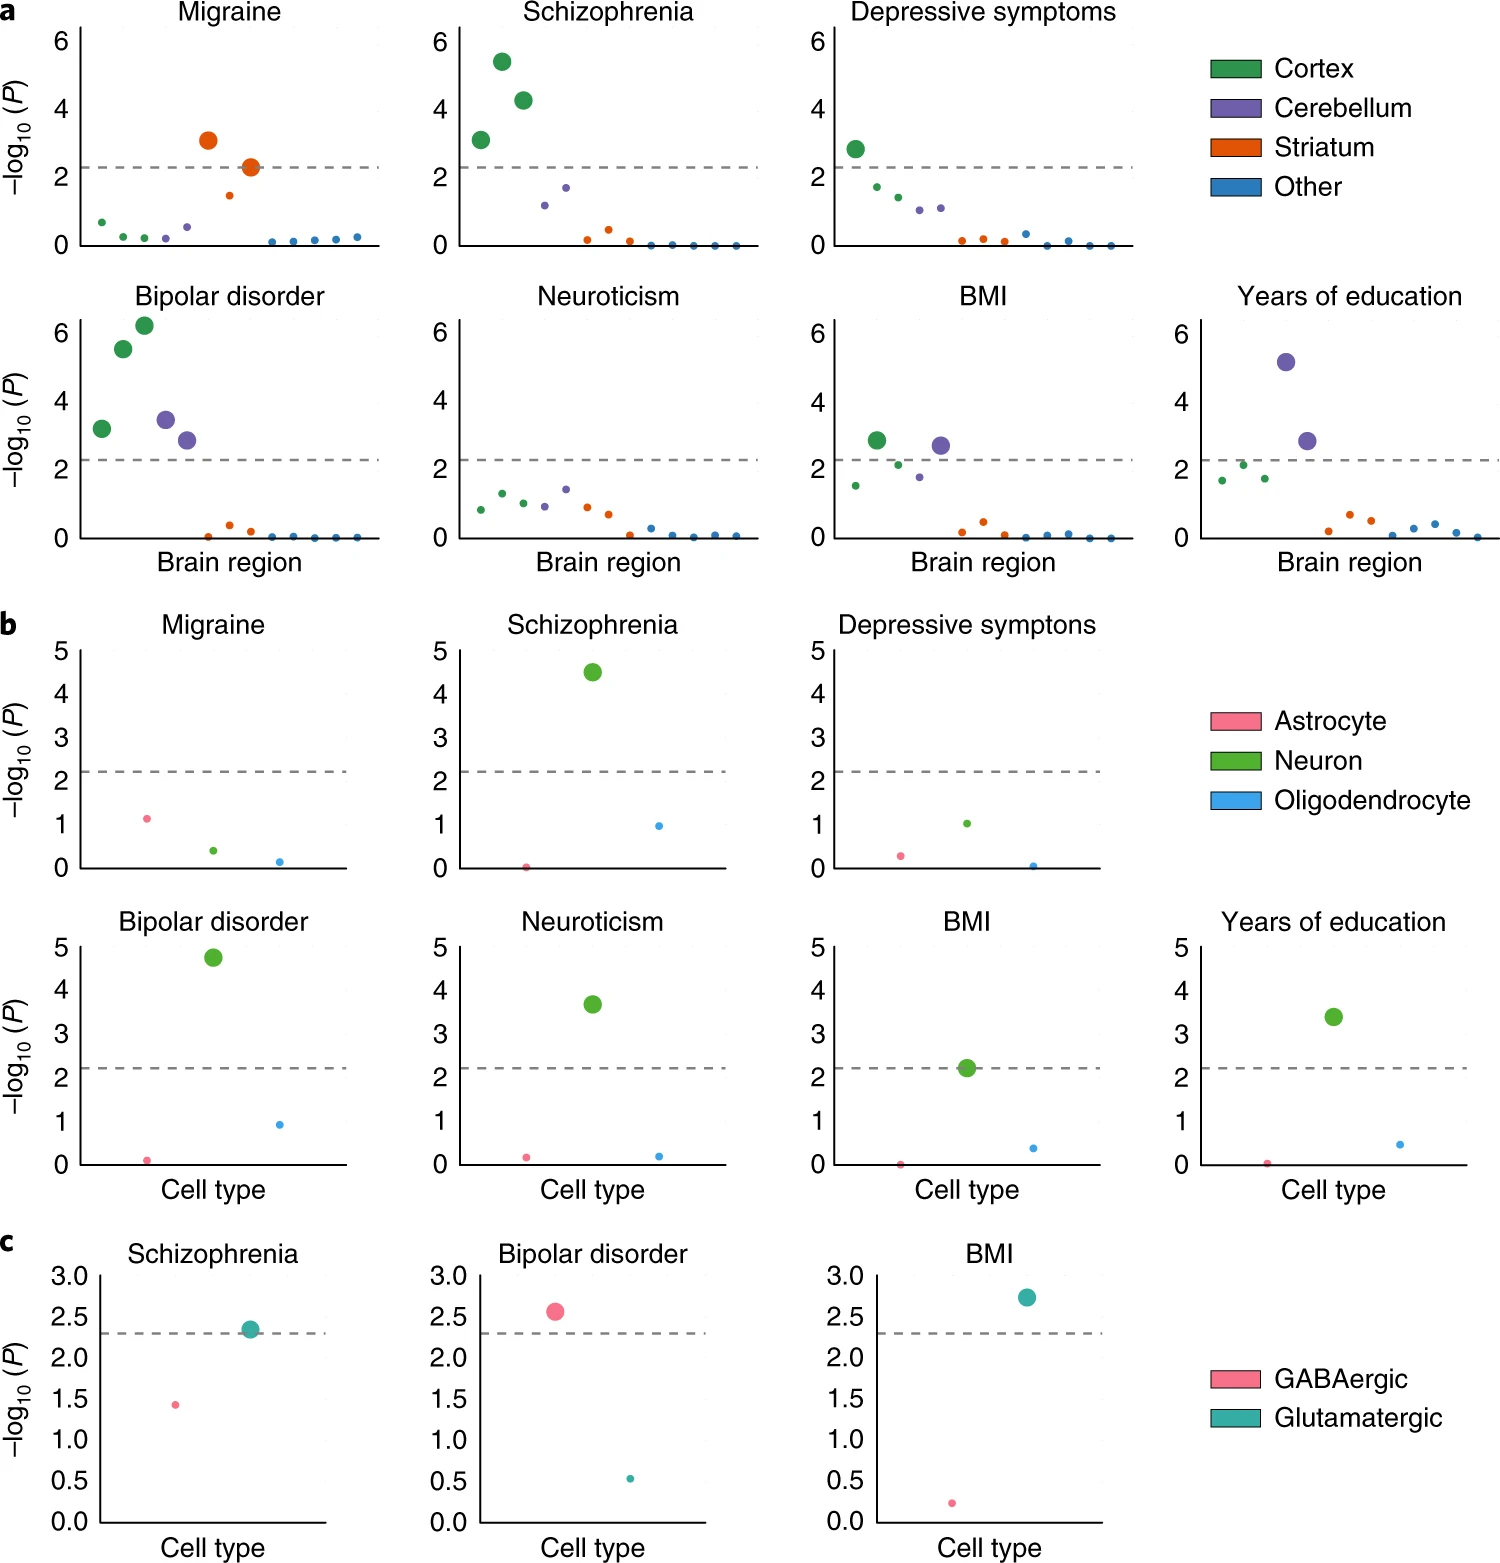
The results here are similar to the one below from this paper but using a different,
older BMI summary stats
Assignment
Select three traits from this list (https://nealelab.github.io/UKBB_ldsc/downloads.html#ldsc_sumstat_files) and download the pre-processed GWAS summary statistics
- Run partitioned heritability using the baseline model
- Estimating proportion of heritability by cell type using the following cells;
Kidney,LiverandCardiovascular - Run cell type specific analysis using the
Multi_tissue_gene_exprandMulti_tissue_chromatintissue sets - Generate plots for each of the sections above